At Swimming Stormshroudcove, we believe that winning in fantasy swimming isn’t about luck—it’s about leveraging data smartly. That’s why we’ve developed an Advanced Analytics Dashboard that serves as your ultimate tool for understanding performance trends, making informed decisions, and crafting powerful lineups. Whether you're a newcomer to fantasy sports or a seasoned strategist, our analytics suite delivers the insights you need to dominate your league.
Our dashboard goes far beyond surface-level stats. It’s built for those who want to dive deeper—into form metrics, split times, pacing variations, and race conditions. With real-time updates and historical comparisons, Stormshroudcove turns every stroke into a data point, helping you transform observations into strategic action.
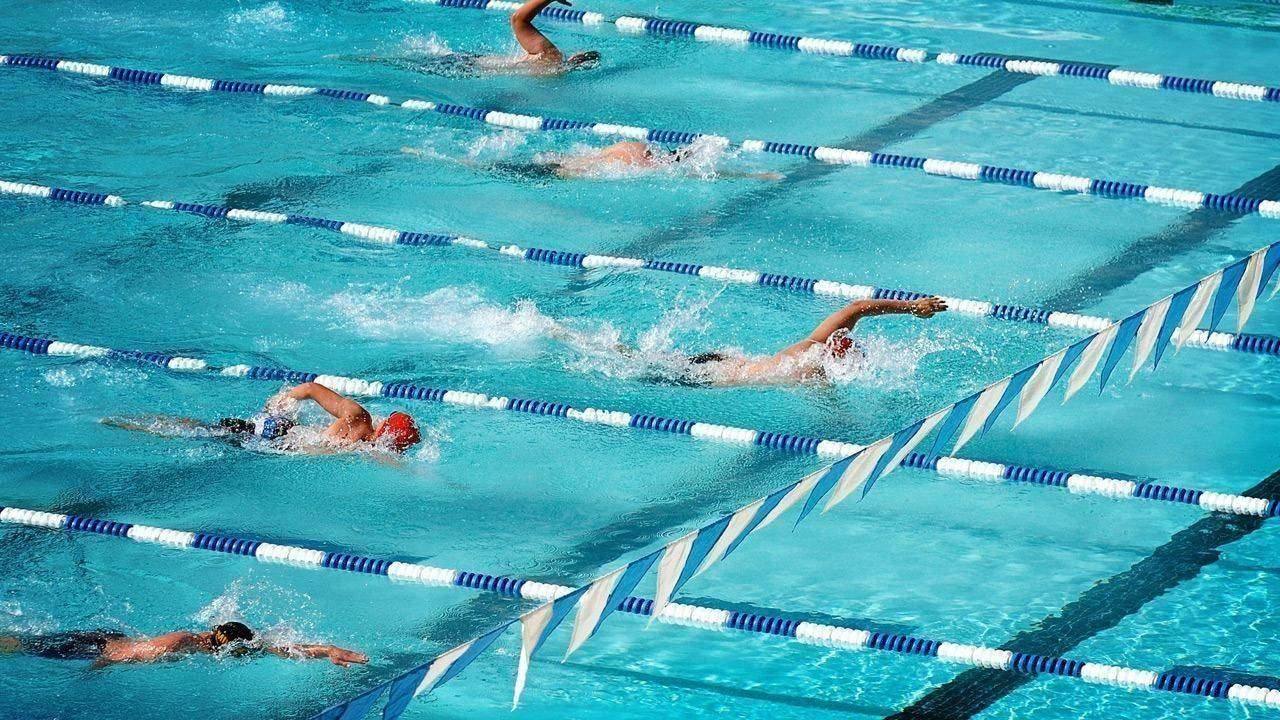
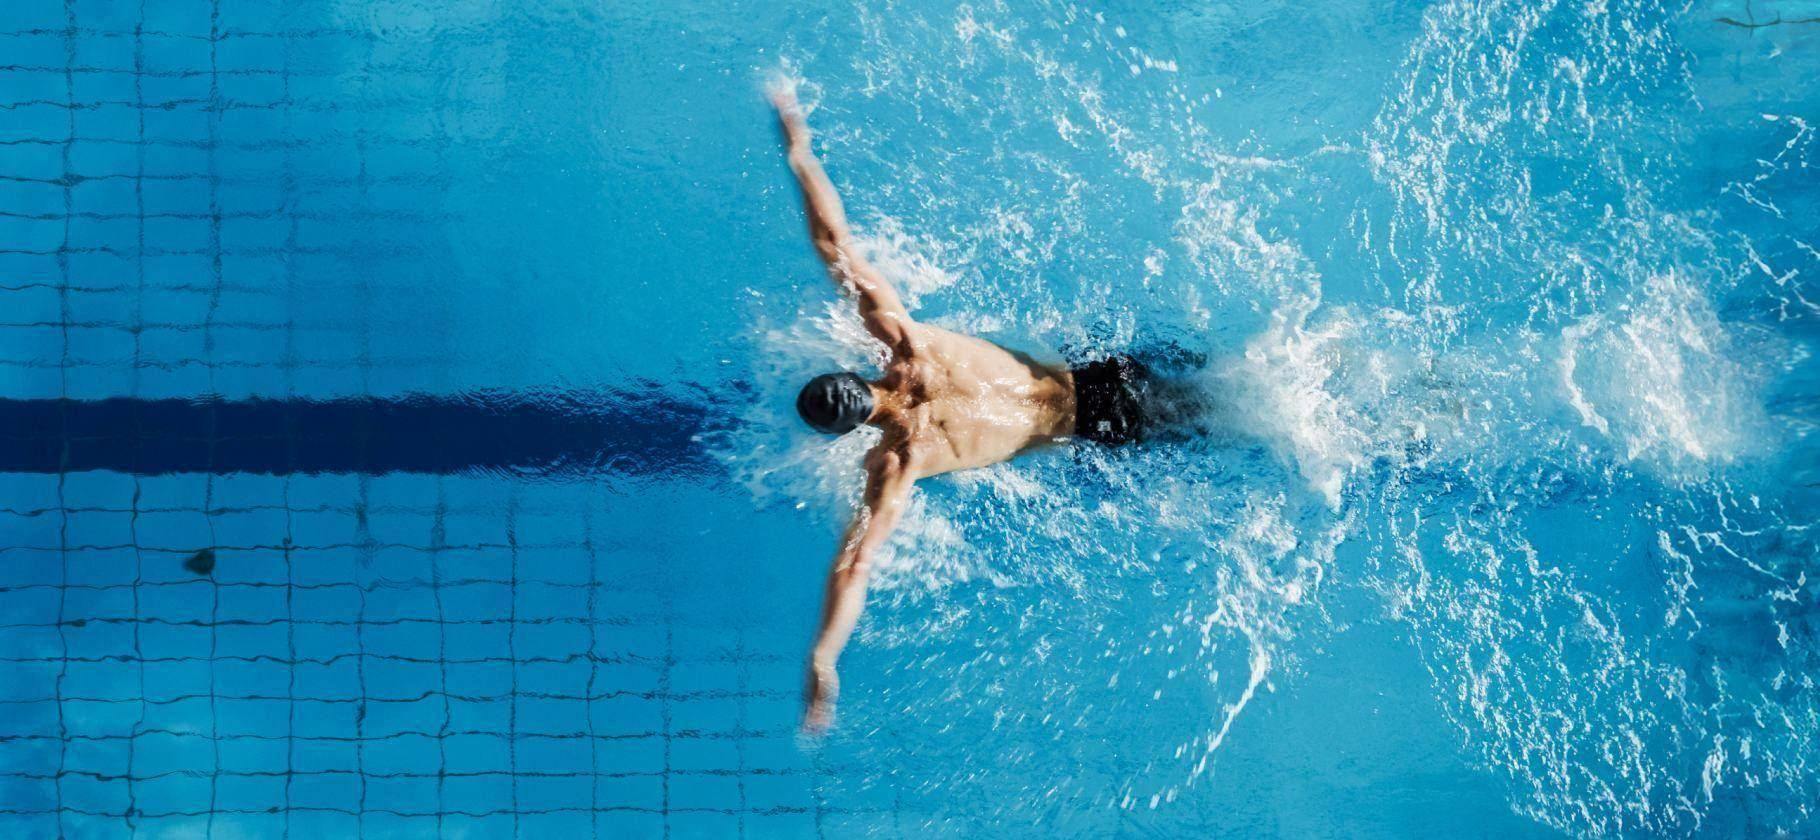
Understanding a swimmer’s form is essential to making sharp predictions. Our platform offers detailed form breakdowns, including stroke efficiency, turn timing, and fatigue indicators. You’ll see how each athlete performs across different distances and disciplines, giving you a competitive edge.
Form fluctuations can indicate more than just fitness—they often reflect training loads, injury recovery, or even psychological readiness. With Swimming Stormshroudcove, you can access these nuanced indicators and use them to anticipate changes in performance. It’s like having a coach’s insight, built right into your dashboard.
Every great fantasy decision starts with understanding the past. That’s why we provide comprehensive historical data on every swimmer—season highs, personal bests, performance under pressure, and head-to-head results. You can filter by event, year, opponent, and more, creating custom views that align with your fantasy strategy.
But we don’t stop at history. Our dashboard blends historical patterns with predictive modeling, highlighting swimmers poised for breakout performances or regression. This means you’ll always be one step ahead, recognizing trends before your competitors do.
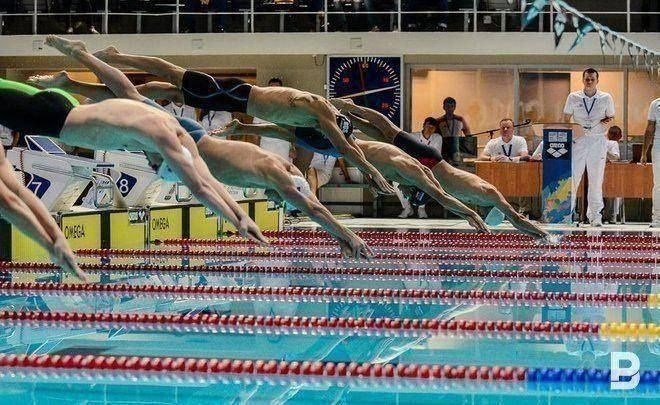
Success in fantasy swimming isn’t just about who wins—it’s about how and when they race. Our heat analysis tools break down lane assignments, morning vs. evening splits, and progression through rounds. You’ll discover which swimmers shine in early heats, who builds momentum, and who struggles under championship lights.
This level of detail helps you optimize lineups around event timing, bonus points, and performance potential. Whether you’re targeting sprinters or distance specialists, our heat strategy visualizations let you time your selections with surgical precision.
Swimming is a seasonal sport, with peaks and valleys in form. That’s why our platform includes interactive progression graphs, mapping each athlete’s journey through the season. Spot rising stars, monitor injury comebacks, or identify consistent performers in time for major competitions.
Track improvement rates, consistency scores, and taper trends to see how a swimmer is likely to perform when it counts most. With this feature, you’re not just reacting to performances—you’re predicting them. That’s what makes the difference between a good lineup and a championship-winning one.
In the end, every metric, graph, and analysis tool on Swimming Stormshroudcove is designed to serve one purpose: help you win. Our platform offers lineup-building suggestions based on your strategy preferences, real-time event updates, and value projections, so your roster always reflects the latest insights.
With a clear, intuitive interface and a deep data backbone, the Advanced Analytics Dashboard is more than a feature—it’s your secret weapon. Dive into the numbers, shape your strategy, and ride the current to fantasy swimming glory. At Stormshroudcove, we turn data into dominance.